Preventing, detecting and recovering payments on fraudulent claims are key objectives for SIU teams across the globe. In order to most effectively accomplish these objectives, you and your teams need to know where you stand in terms of current investigative performance. This not only gives insight into how your programs are performing over time, but also lets you know where you stand in the industry.
Insurance claims KPIs, do they really matter?
So, what should an SIU be looking at on a regular basis? What do each of these key performance indicators (KPIs) mean? Let’s start with personal program performance. After establishing a baseline of how an SIU program typically performs overall, regular evaluation of each investigator’s performance is one of your best indicators that there is a major problem arising that needs immediate attention. Alternatively, a significant increase in performance can be indicative of an unexpected improvement in a process that you’d like to implement more universally. You catch my drift.
When it comes to measuring, what exactly should you be tracking? What are they key pieces of the puzzle that can tell you not only how you are performing but where you can improve? Throughout my tenure in the industry, I have seen 5 core KPIs tell the intricate story of fraud detection. These 5 sources of measurement include Alert Rate, Hit Rate or what some refer to as Qualification Rate, Acceptance or Investigation Rate, Impact, and a lesser-known metric, Transformation Rate. Let’s go into each of these and what they really mean for you and your teams.

Key metrics for measurement using insurance analytics software
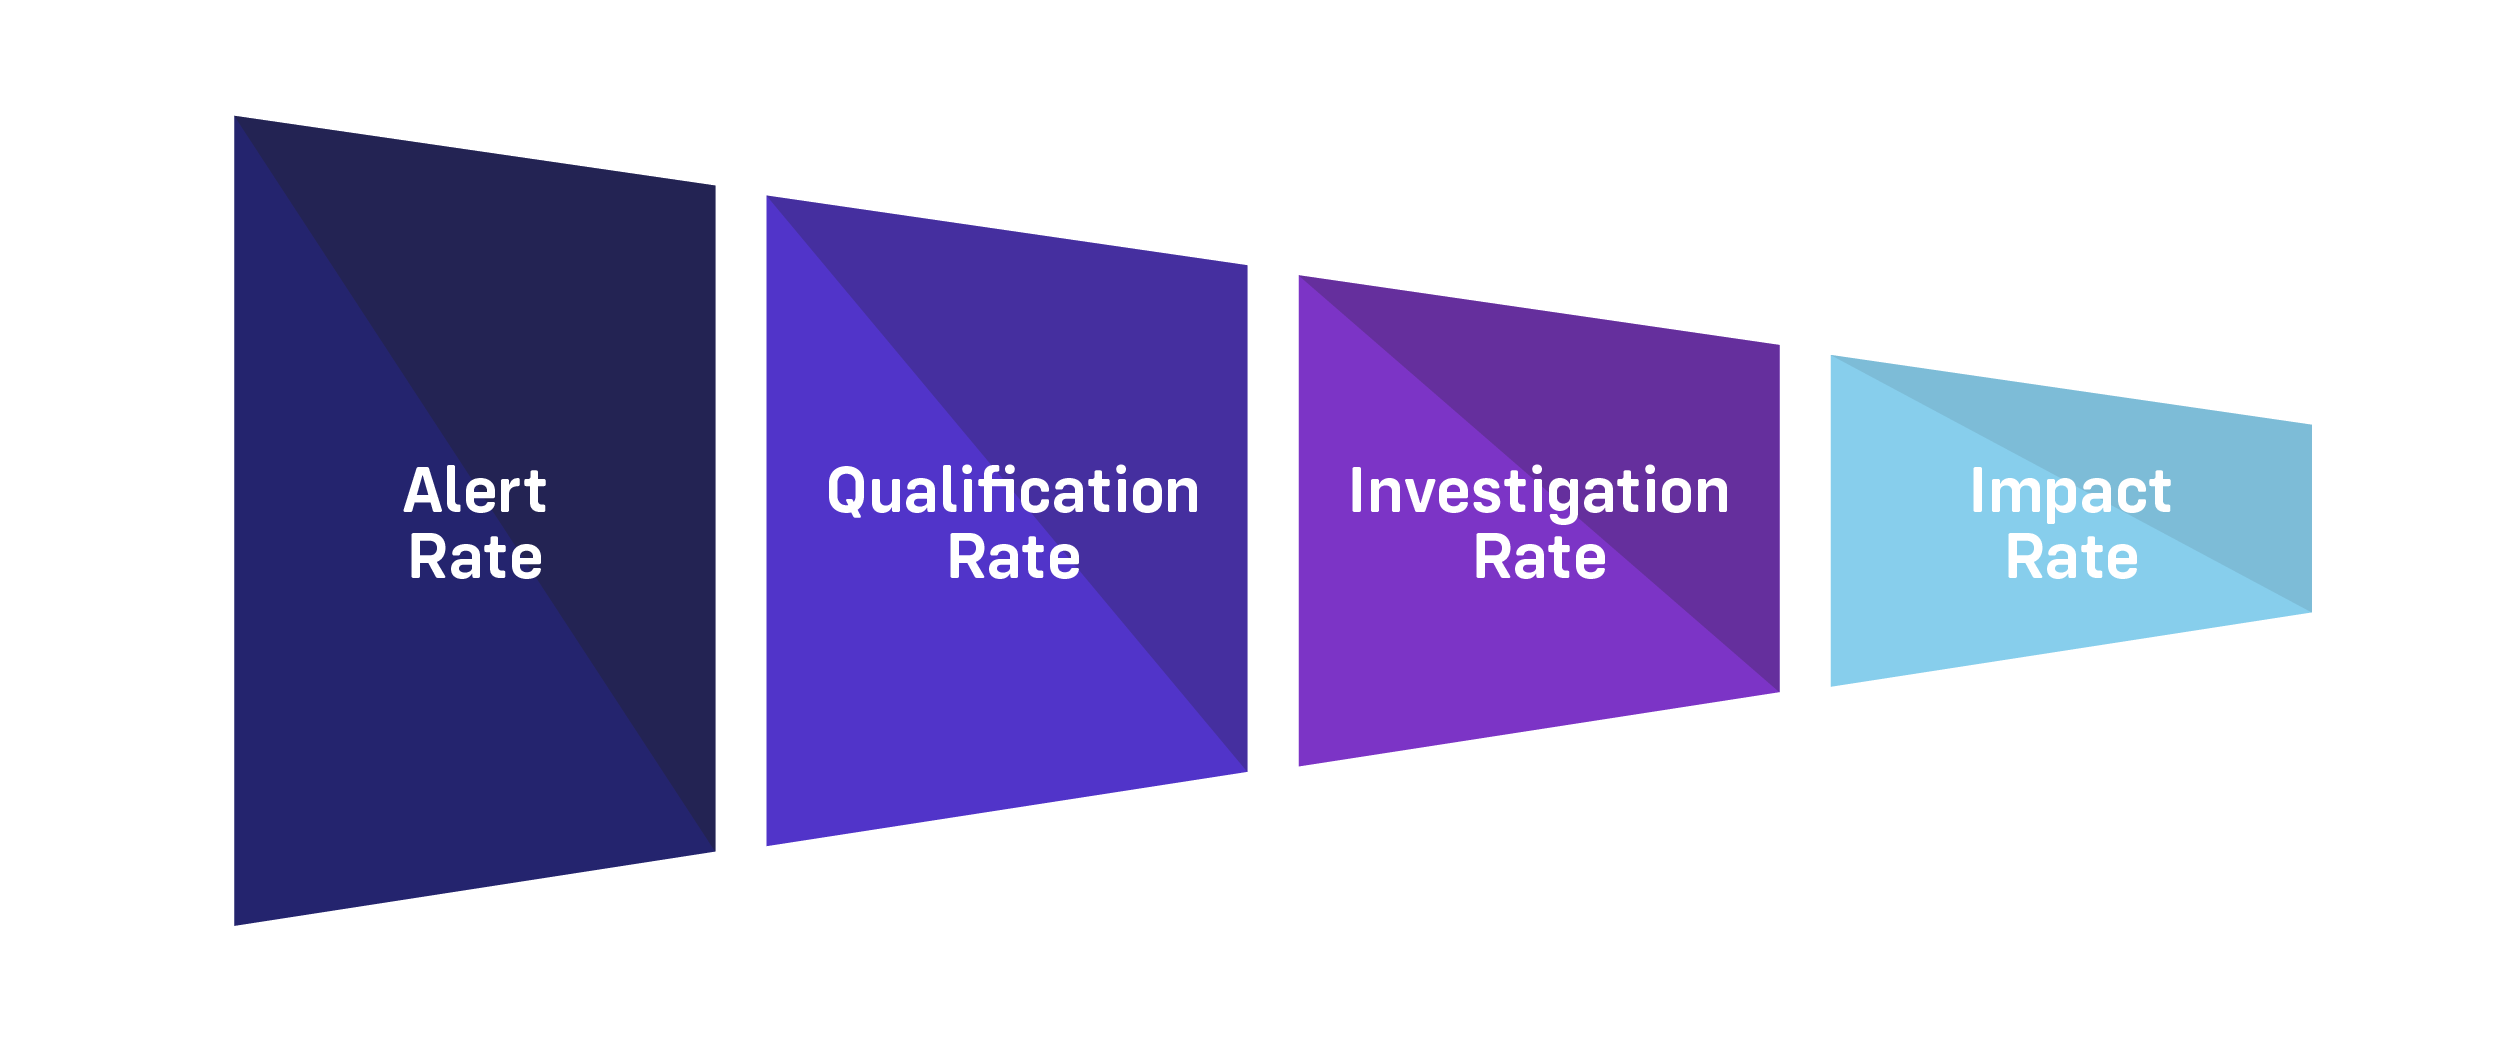
1. Alert Rate
First, we have the Alert Rate. This is what really kicks off the claims process and is defined as the number of alerts sent to the SIU team over the number of claims analyzed. A carrier can’t investigate every claim so the fraud detection solution, investigative resources and strategy combine to determine what an appropriate target Alert Rate might be.
2. Qualification Rate
Again, depending on the carrier’s resources and strategy, a number of those alerts are reviewed to make the decision on whether or not SIU should investigate them. Those reviewed alerts are considered to have been qualified and the number qualified over the number alerted determines the Qualification Rate. This number can be used to determine if the carrier needs to adjust resources to properly address the volume of alerts.
3. Investigation Rate
With any fraud detection solution, the goal is not to investigate every alert. That would indicate the detection is too stringent. So to get a sense of how the detection is performing, the carrier considers the qualified alerts, how many are accepted for investigation by SIU. This Acceptance or Investigation Rate is determined by the number of alerts accepted for investigation over the number of alerts qualified.
4. Impact Rate
Finally, the Impact (Conversion) Rate is indicative of the percentage of SIU investigated that resulted in an impact. An impact can consist of a denial, compromise, withdrawal or recovery on a claim involving suspected fraud. It shows the program's capacity to transform suspicious alerts into financial impact.
5. Transformation Rate
Now, I told you there were 5 core KPIs and we’ve only gone over 4 thus far. These 4 give you a view into performance at specific points in time along the claims cycle. Transformation rate, however, is a KPI that can be used to provide a total claims cycle evaluation. While it does not replace the individual metrics, it serves as a good way to compare performance despite differing resources and strategies. So, what is it exactly? Transformation rate is the Acceptance Rate x Impact Rate. So whether a carrier is able to cast a wide and deep or narrow and shallow net, the resulting Transformation rate can be compared. This metric also provides insight into the level of success in both the accuracy of referrals and the ability to investigate and resolve fraudulent claims.
Transformation Rate = Acceptance Rate x Impact Rate
What does this mean for me and my team?
As I mentioned in the beginning of this perspective, measurement is key in evaluating the performance of your team and program. Additionally, these KPIs layer up into the SIU’s overall objectives and ultimately the objectives of the organization. For example, if your objective is to increase SIU’s number of touchpoints into claims, the Alert Rate would be a relevant metric. If you are trying to adjust staffing levels for a triage team, the Qualification Rate will help you decide on the right number of people needed. If your goal is to have a greater quality of alerts, the Acceptance Rate would provide good insight. Lastly, if your goal is to improve SIU’s impact, the Impact Rate or Transformation Rate would be appropriate metrics.
The Shift Technology difference
As the first AI platform focused specifically on the needs of insurers, we at Shift pride ourselves on being able to improve each and every one of these key metrics for our customers. But let’s save that discussion for another time.
In terms of reporting itself, pulling, analyzing and reporting on KPIs takes significant time and resources when done manually. Shift KPI reporting provides SIU teams with an in-depth understanding of their program performance, saving significant time for both managers and users. While internal use of these metrics is key, we also know that there are state requirements for reporting on a regular basis. With Shift, customers are able to generate and utilize fraud performance reports to fill these state requirements saving teams both time and resources. As clients enable reporting, Shift is able to provide benchmarking performance metrics for the client base. This allows clients to have better insight into how they are performing compared to similar clients. Lastly, Shift can instantly design custom, advanced queries that can be used for one-time or recurring analysis.
If you’d like to learn more about what Shift can do for your insurance fraud performance metrics please request a demo of our product and reporting tool here.
About the Author